
AP Computer Science :: Lessons :: Debugging in BlueJ
Error Types
Errors are generally unavoidable when writing a program, although good planning can prevent most of them. A syntax error occurs when you violate a rule in the programming language such as forgetting a semicolon at the end of a line. If you have a syntax error you will not be allowed to compile your program. Java will point out the error and BlueJ will try to give you information to fix the error.
Run-time errors, or compile-time errors, happen when your code ask the computer to perform an operation it can't handle, such as dividing by 0. BlueJ will give you an error message that may help you understand what went wrong. These errors occur while your program is running and will cause your program to crash.
Logic errors, also called design errors or bugs, occur when the program does not behave in the way we expect it to due to faulty programming logic. A logic error is the hardest of the three error types to detect because BlueJ cannot notify you of logic errors. Only proper testing can detect logic errors.
Debugging
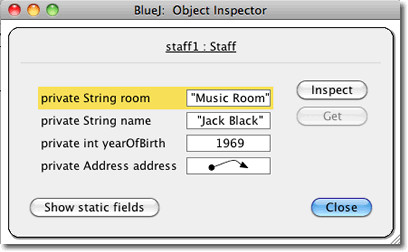
When you right-click on objects in BlueJ you may notice there is an "Inspect" option. You can inspect an object to see its internal values.
- Download the people2 example project.
- Create a new instance of the Staff class using the constructor that has parameters.
- Name the instance "staff1".
- Enter values for the input it asks for.
- Right-click on the "staff1" instance and choose "setAddress" under the methods inherited from Person.
- Set the address for the staff member.
- Right-click on the "staff1" instance and choose "Inspect".
You can see the values of all of the variables that are set. You will notice the address is shown as an arrow. That's because address is an object that contains multiple values. You can keep clicking the Inspect button to drill through the various object levels. Since strings are objects you can inspect them to find the character array in the background.
Finally, we will learn how to debug our programs. We will open another project to do this.
- Download the debugdemo project.
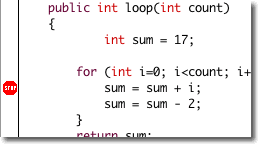
- Double-click the Demo class.
- Find the for loop inside the loop method.
- Click in the bar to the left of the text to set a breakpoint in the for loop.
A breakpoint lets you interrupt the execution of a program to investigate your code. You can use breakpoints to learn how certain sections of a program work or to determine if a section of code is working as you expected.
- Create an instance of the Demo class and call it "demo1".
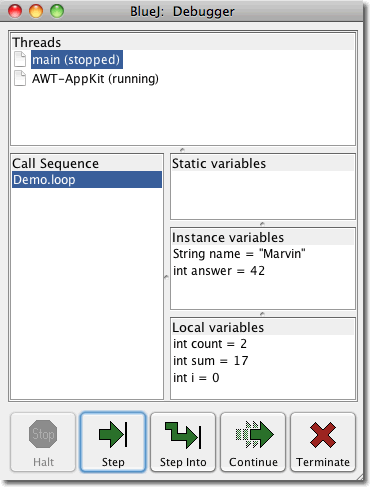
- Run the loop method and type 5 as the parameter.
The debugger window will appear that allow you to step through your project. Execution stops before the line where you put the breakpoint is executed. The Step Button executes a single line of code and then stops execution again. The Continue Button will continue execution of the program again until it reaches another breakpoint. The debugger window will show you the value of all variables and objects, and whether they are local variables.
- Create a new instance of the Demo class and call it "demo2".
- Place a breakpoint next to the line in carTest() that says places = myCar.seats().
- Call the carTest method from the instance.
Using the Step Into Button on a line that contains a method will enter that method and execute its code line-by-line. If you use that button on any other line it behaves just like the Step Button.


