
User Interface Design :: Lessons :: Web Research Methods
Usability Case Study: Midwest Microwave Website
Once upon a time, this bizarre help message was popped up by a website (Midwest Microwave) when users requested to view the site's product catalog. The message appears before the catalog is displayed. Clearly this message is a patch for usability problems in the catalog itself. But the message itself has a lot of usability problems of its own! How many problems can you find? Here are a few:
- Overwhelming the user with detail. What's important here, and what isn't? (minimalist design)
- Horrible layout: no paragraphs, no headings, no whitespace to guide the eye (aesthetic design)
- No attempt to organize the material into chunks so that it can be scanned, to find out what the user doesn't already know (visibility)
- This information is useless and out of context before the user has seen the task they'll be faced with (help and documentation)
- It's a modal dialog box, so all this information will go away as soon as the user needs to get to the catalog (minimize memory load)
- Using technical terms like V.90 modem (speak the user's language)
- "Please carefully jot down the Model Numbers" (recognition, not recall)
- Poor response times: 20-60 second response times (user control and freedom), though in fairness this was common for the web at the time, and maybe Acrobat has sufficient progress interfaces to make up for it.
- Misspelling "our catalog" in the first line (speak the user's language)
This lesson is about usability evaluation in the brave new world of the Web. The Web enables experiments on a larger scale, for less time and money, than ever before. Websites with millions of visitors (such as Google, Amazon, Microsoft) are capable of answering questions about the design, usability, and overall value of new features simply by deploying them and watching what happens. The trick lies in how to conduct those experiments. Today's lesson will discuss some of the latest practices in online experimentation.
A/B Testing
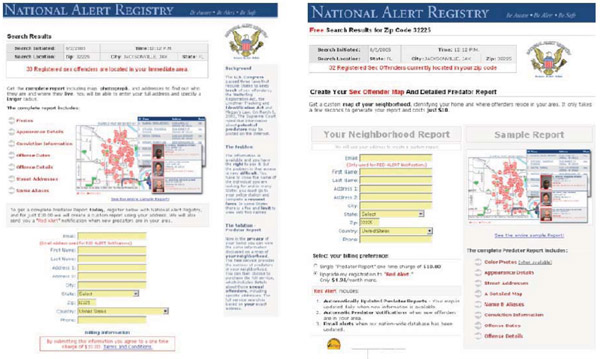
Let's start with an example. Here are two versions of a web page, for a site that sells customized reports about sex offenders living in your area. The goal of the page is to get visitors to fill out the yellow form and buy the report. Both versions of the web page have the same information; they just present it in different ways. In fact, the version on the right is a revised design, which was intended to improve the design by using two fat columns, so that more content could be brought "above the fold" and the user wouldn't have to do as much scrolling.
We could look closely at these examples and pick them apart with respect to usability principles (visibility, learnability, efficiency, etc.), and the designers were doubtlessly thinking about principles and justifications for the design decisions they made. But at the end of the day, which design is more effective for the end goal of the web site – converting visitors into sales?
The designers answered this question by conducting an experiment. Half the users to their web site were randomly assigned to see one version of the page, and the other half saw the other version. The users were then tracked to see how many of each actually filled out the form to buy the report. In this case, the revised design actually failed – 244 users bought the report from the original version, but only 114 users bought the report from the revised version.
The important point here is not which aspects of the design caused the failure (which I frankly don't know, because a variety of things changed in the redesign). The point is that the web site conducted a randomized experiment and collected data that actually tested the revision. That's not the same as just rolling out the revised version and seeing what happens – there's a subtle but important difference. This kind of experiment is often called an A/B test.
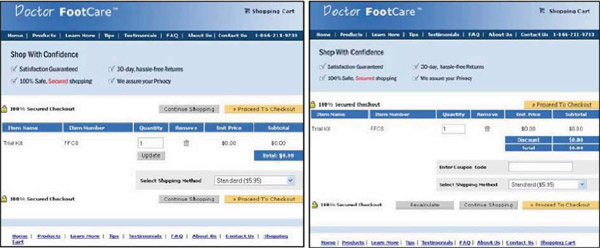
Here's another example – a shopping cart for a web site. Again, a number of changes have been made between the left side (the original version) and the right side (the revised version). When this redesign was tested with an A/B test, it produced a startling difference in revenue – users who saw the cart on the left spent ten times as much as users who saw the cart on the right! The designers of this site explored further and discovered that the problem was the "Coupon Code" box on the right, which led users to wonder whether they were paying too much if they didn't have a coupon, and abandon the cart. Without the coupon code box, the revised version actually earned more revenue than the original version.
One more example. At the end of every page in Microsoft's online help (e.g. for Word and Excel) is the question on the left, asking for feedback about the article. If you press any of the buttons, it displays a textbox asking for more details.
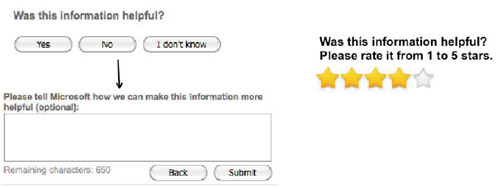 A proposed revision to this interface is shown on the right. It was motivated by two arguments:
(1) it gives more fine-grained quantitative feedback than the yes/no question; and (2) it's more
efficient for the user, because it takes only one click rather than the minimum two clicks of the
left interface.
A proposed revision to this interface is shown on the right. It was motivated by two arguments:
(1) it gives more fine-grained quantitative feedback than the yes/no question; and (2) it's more
efficient for the user, because it takes only one click rather than the minimum two clicks of the
left interface.
When these two interfaces were A/B tested on Microsoft's site, however, it turned out that the 5- star interface produced an order of magnitude fewer ratings – and most of them were either 1 star or 5 stars, so they weren't even fine-grained.
The term "A/B testing" actually comes from marketing. Other fields have other names for the idea – in the context of usability studies in the lab, we've been calling them controlled experiments. The setup is basically the same: you choose an independent variable (like the UI design) with at least two alternatives to test; you choose a dependent variable that you're going to use to measure the difference between those alternatives.
The distinction in web-based A/B testing is that your website automatically and randomly assigns users to a condition.
A/B testing can be risky. Because you're doing your testing with real users on a deployed system, bugs can have real consequences. You shouldn't go to a 50/50 ratio between control and treatment immediately. Ramp up slowly: first 99.9%:0.1%, then 99%:1%, etc.
You can use hashing to partition users. You can create a hash using MD5 (a more secure algorithm isn't necessary since the random assignment is not stored anywhere). The hash can be a combination of the user id and the experiment name. The 128-bit value that is generated will be on one side or the other of the possible 128-bit space. Initially the partition will be unbalanced (99%:1%), but gradually you will move to a 50:50 split. This is better than random number generation because it doesn't require storage of the assignment and it can be done independently by different servers.
If the experiment involves too few users, then it may fail to reject the null hypothesis even though it's false. Power is the probability of correctly rejecting the null hypothesis when it's false. The number of users you need depends on the following:
- Power desired (typically 80-90%)
- Number of conditions
- Variance of the dependent variable
- Effect size: how much of a difference in dependent variable you care about for decision making
- Statistical test you're using
The number of users required determines the running time of the experiment based on the visit rate of your website.
An A/A test is an "experiment" that divides users into two groups with the same condition for both groups. This is good for testing the experiment infrastructure. You shouldn't see any difference between the groups, but if you run 20 A/A tests and test them at the 5% significance level, then on average one of the tests will show a (phantom) significant difference. A/A tests also allow estimating the variance of the dependent variable which is useful for power calculations.
Ethics: A/B testing never asks the user's permission to be involved in the test, and doesn't get informed consent. What do you think about that?
Predictability: when a user visits the website, things might (randomly) be different. What's the effect of that?
Numbers, but no explanations: as we saw in our examples at the beginning of the lesson, you get data about how a new design affected bottom-line indicators, but you don't really find out why. One solution to that is to break down a design with several changes into a few experiments, testing changes individually. Another is to complement large-scale A/B testing with small-scale user testing in the lab, where you have the advantage of think-aloud protocols.
Short-term vs. long-term: a typical A/B test runs only for days or weeks, while the real effect of a new design might be seen only over a long term, as users learn how to use it well. But it's worth noting that even days or weeks is a longer term than a typical lab-based user study, which might last at most a few hours.
Remote Usability Testing
There are two ways to do remote usability testing. Remote synchronous testing uses a webcam, audio, and/or remote desktop connection to conduct the testing in real time. This is shown to be just as effective as face-to-face testing. There are two approaches to remote asynchronous testing, which does not happen in real time:
- Approach 1: User identifies and reports critical incidents themselves
- Like bug reporting, but for usability problems
- Users slow down by 3x and report only half as many problems as trained observers would
- Approach 2: Install instrumentation in the website to track a user's actions
- Shows details of interaction, but lacks think-aloud and insight into user's goals and intentions
Recruiting Users Online
Craigslist is a good source for lab subjects. Many universities also have procedures in place for you to find subjects. Mechanical Turk is a labor market for tiny online tasks. For example, you could pay someone $0.01 to give some keywords for an image. The site is increasingly used by HCI researchers and social scientists to recruit users. Google AdWords is another way to recruit users as it generates high traffic flow, but also potentially high cost.


